Apprentice Guide: How to Impress IT Employers
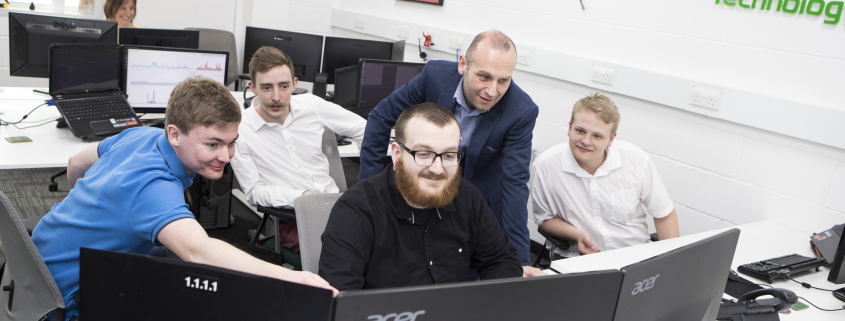
This week (3-7 February) is National Apprenticeship Week 2020. Dogsbody Technology have been hiring IT apprentices since 2013 and have seen A LOT of apprentice CV’s in that time!
It still surprises us that applicants don’t sell themselves well, and is one of the biggest reasons we still give telephone interviews to a vast majority of the CV’s we get sent.
Let us help you a little with our guide on how to impress an IT employer like ourselves…

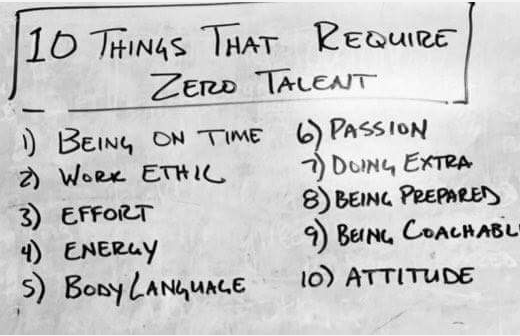
Be more than just grades
Some people are academic and some people aren’t… apprenticeships are designed for people who can’t or don’t want to go to university (and let’s not even mention the minimum 27K debt for university graduates). At Dogsbody we are not just interested in a list of good grades; we want to see and hear about the things you are passionate about, what you have taught yourself, what you have done outside of education! It’s key to find things that keep you interested and just “play” with as much tech as you can 🙂
I set this company up to play with big servers and big infrastructure so why not get paid to do it … the best staff are the ones that just want to play with technology too. We come to work to play.
– Dan Benton, Director of Dogsbody Technology
Raspberry Pi & Arduino
There is so much affordable tech out there right now. Raspberry Pi and Arduino are at the forefront where you can get a fully working system for £15-45. With them you can learn everything from Linux internals, Python programming or Game design.
At Dogsbody HQ we are big fans of Raspberry Pi (we have 4-5 around the office doing a variety of jobs). It’s an awesome tool for people to learn as it’s cheap, powerful and, of course, open source. There is a great index of projects that should be a great source of inspiration.
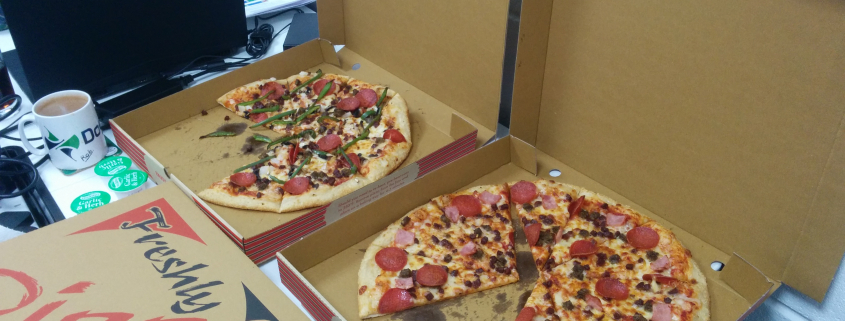
Arduino allows you to learn I/O based programming with ease. We designed a pizza order printer for one of our first customers using Arduino that is still in use to this day. More examples can be found on their projects page.
Magazine, Blogs and news
Access to information has never been easier (back in my day we had a copy of Microsoft Encarta and were grateful 😉 ). Youtube, podcasts and free online courses mean you can learn anything you want for free off your own back.
We specifically recommend Raspberry Pi blog and their magazines, MagPi, Wireframe and HackSpace magazines which you can buy in the shops but are also totally free to download!
You’ll be amazed at what you can learn for free in your spare time.
Hacker Space / Maker Groups
A hackerspace (also referred to as a hacklab, hackspace, or makerspace) is a community-operated, often “not for profit” , workspace where people with common interests, such as computers, machining, technology, science, digital art, or electronic art, can meet, socialize and collaborate.
Check out your local maker spaces and any local after school or college clubs (they don’t usually have to be your school or college). A quick google should show you what is in your area but we particularly recommend checking out Code Club and CoderDojo. A great way to try new things, make friends with like minded people and find out what really interests you with little investment.
Of course if you want to go full geek – we highly recommend Glastonbury for Geeks – EMF Camp.
Fancy a career in Linux IT? Take a look at our our jobs page for our current openings.
Also check out our open letter to future apprentices to see more way to impress us or other employers.


 Dogsbody Technology are passionate about Apprenticeships, providing a new career opportunity to people and promoting an alternative to University for those leaving college.