Tag Archive for: opensource

Open-sourcing our Raspberry Pi Displayboard

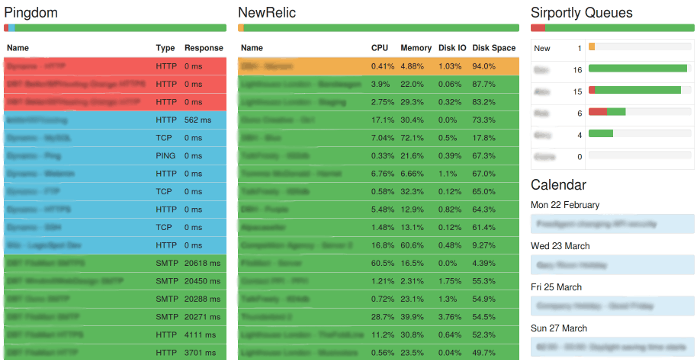
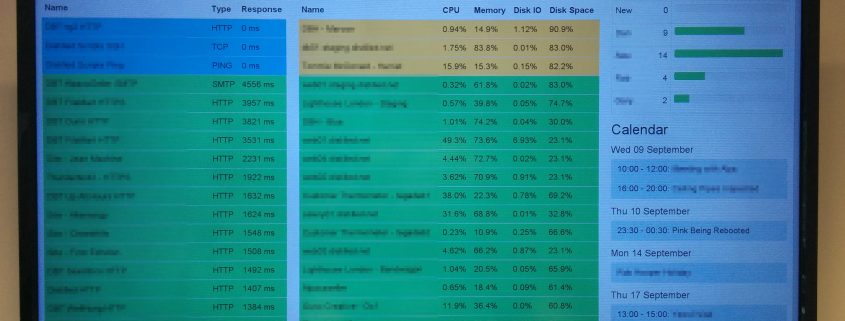
Our office warboard runs off a simple Raspberry Pi plugged into a wall mounted TV however the code to get this to work reliably has taken a bit of tweaking over the years.

Today we continue our efforts to give back to the open source community by publishing our recipe for a solid, stable displayboard that can be used for anything from digital signage to office displays.

You can find all the code in our pi-display GitHub Repo.

This code…

  • Waits for the TV/display to be turned on before proceeding.
  • Reconfigures the resolution to match the best resolution the TV/display has to offer.
  • Fixes itself and any bad configuration should corruption occur from a bad webpage.
  • Works with the latest SSL technologies (TLS1.2).
  • Supports CEC commands allowing you to control the TV via the HDMI cable.
  • Installs fonts required for correct webpage rendering

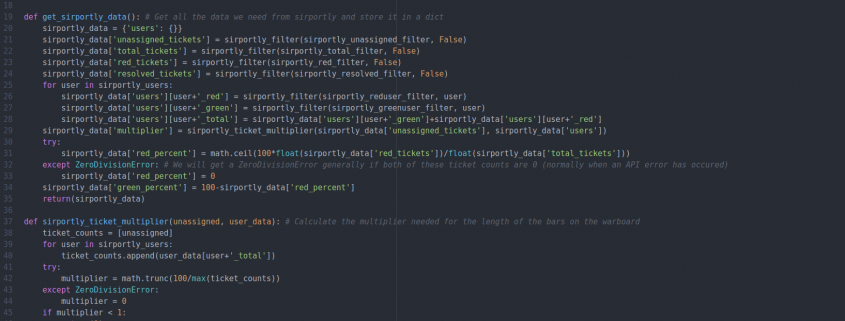
Our office warboard is not only locked down to certain IP addresses but also uses the latest SSL protocols and ciphers. The stock chromium on Raspberry Pi wasn’t up to date (v22 when the current version is v51) and didn’t support the latest security protocols.

This repo used to use the epiphany browser instead which was more up to date (but not as stable). Now (28 Sep 2016) the Raspberry Pi team have released PIXEL which includes a much more up to date version of the Chromium browser.

This install also downloads and compiles the latest cec-client that allows you to turn the TV on and off each day via cron.

Let us know if you find this useful and feel free to fork and/or make pull requests 🙂

The Warboard

The Dogsbody Technology Warboard sits on the wall in our office and allows us to see a detailed overview of the infrastructure we monitor real time, this has proved it’s self to be invaluable for spotting potential issues and remedying them before they ever become an issue.

We’re responsible for monitoring and maintaining hundreds of servers on a daily basis.  Checking the status of this infrastructure manually would be virtually impossible. To make this job easier we use tools such as Pingdom and NewRelic however we still felt the need for a high level overview of all servers.

When there is an issue with either a service failing on a server, or the health of a server deteriorates Pingdom and NewRelic will alert us real time via custom webhooks we have written. These are great for reacting to an issue when it happens, however it doesn’t give us a clear overview of the infrastructure we monitor before an issue occurs, this is why we created the Warboard.

The Warboard is displayed in such as way that we only see the metrics we need to. Services at the top of the Pingdom column are ordered by highest response rate, servers in NewRelic are ordered by the highest metric for each server (if CPU utilisation was a higher percentage than memory, disk usage and disk IO it would be used). We display the Warboard on a wall mounted TV for the whole team to see.

Warboard

Example screenshot of the warboard

In the Pingdom column red checks are checks that are currently down, blue checks are paused and green checks are up. In the NewRelic column red checks are servers that have hit their high threshold on their policy, amber checks have hit their warning threshold, blue checks are servers that are no longer reporting and green checks are servers that have not reached a threshold.

We also have a column for Sirportly, our ticketing system. This shows how many tickets each team member has. Below this is an overview of events in our Google Calendar where we can see upcoming events and scheduled maintenance.

The Warboard backend is all written in Python and the frontend is Python (Flask) using the Jinja2 templating engine. We’ve made the Warboard public on Github, so feel free to contribute, modify it and use it in your own environment if you please.

If you’d like us to monitor your infrastructure be sure to take a look at our maintenance packages and get in contact.